UPDATE: View the latest NottinghamMD.com zip code reports here.
Original story below…
——
NOTTINGHAM, MD—The Maryland Department of Health on Wednesday reported that ICU bed usage and COVID-19 hospitalizations rose over the past 24 hours.
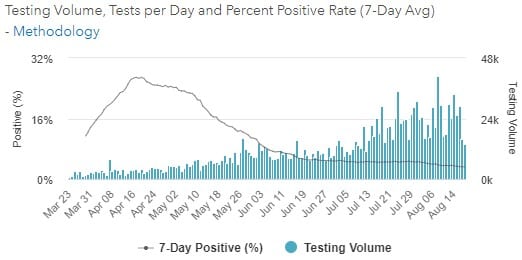
As of Wednesday, there have been 101,649 cases of novel coronavirus in Maryland, an increase of 414 cases since Tuesday. A total of 13,829 tests were performed over the past 24 hours. Maryland has now conducted 1,675,530 tests.
The statewide positivity rate stands at 3.22%, a slight increase from Tuesday’s 3.21%. Baltimore County’s positivity rate stands at 3.42%, a slight increase from Tuesday’s 3.41%.
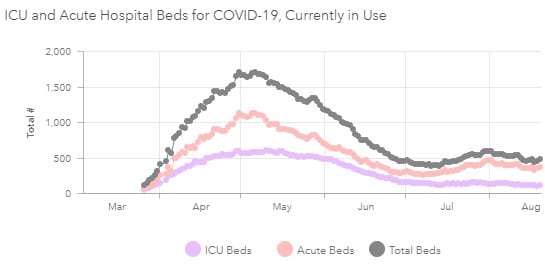
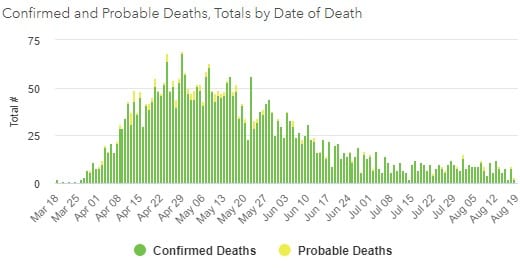
There have been 3,522 related deaths and 475 individuals are currently hospitalized…an increase of 11 deaths and 22 hospitalizations since Tuesday. A total of 107 ICU beds are currently in use, an increase of 5 beds since Tuesday.
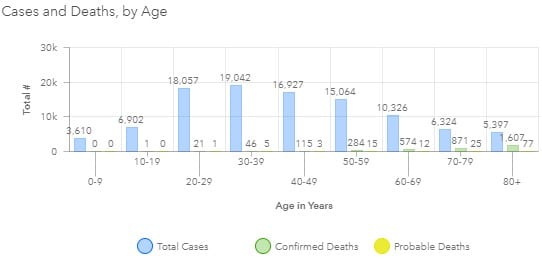
Approximately 70% of Maryland’s COVID-19 fatalities have been among those over 70 years of age (2,478/3,522), as seen in the chart below from the Maryland Department of Health.
The updated Maryland COVID-19 mortality rate by age group can be viewed here.
There have now been 1,074,119 negative test results and 6,030 patients have been released from isolation.
Baltimore County has confirmed 14,180 COVID-19 cases and and 558 (+5) deaths (note: “probable” deaths are not included in these totals).
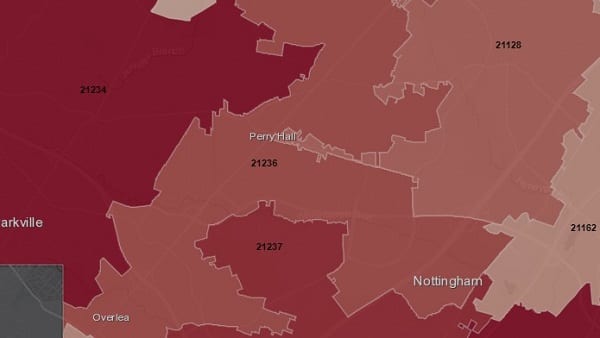
Case breakdown by zip code in NottinghamMD.com’s coverage area:
- 21128 (Perry Hall) – 183 cases (+1)
- 21162 (White Marsh) – 69 cases (0)
- 21234 (Hillendale/Parkville/Carney) – 1,216 (+7)
- 21236 (Overlea/Fullerton/Nottingham) – 559 cases (+9)
- 21237 (Rossville/Rosedale) – 681 cases (+6)
Previous zip code reports can be viewed here.
“Maryland is now reporting a seven-day positivity rate of 3.22% and a daily positivity rate of 3.65%,” said Governor Larry Hogan on Wednesday. “There are 475 total COVID-19 hospitalizations and 107 ICU beds in use. The positivity rates for Baltimore City (3.84%) and Prince George’s County (5.12%) are record lows.”
View the Maryland Strong: Roadmap to Recovery here.
Additional charts and data from the Maryland Department of Health can be found below.
Do you value local journalism? Support NottinghamMD.com today.

